 |
|||
|
|
|||
|
|
|||
| ||||||||||
|
|
 TM 38-400/NAVSUP PUB 572/AFMAN 23-210 MCO 4450.14/DLAM 4145.12
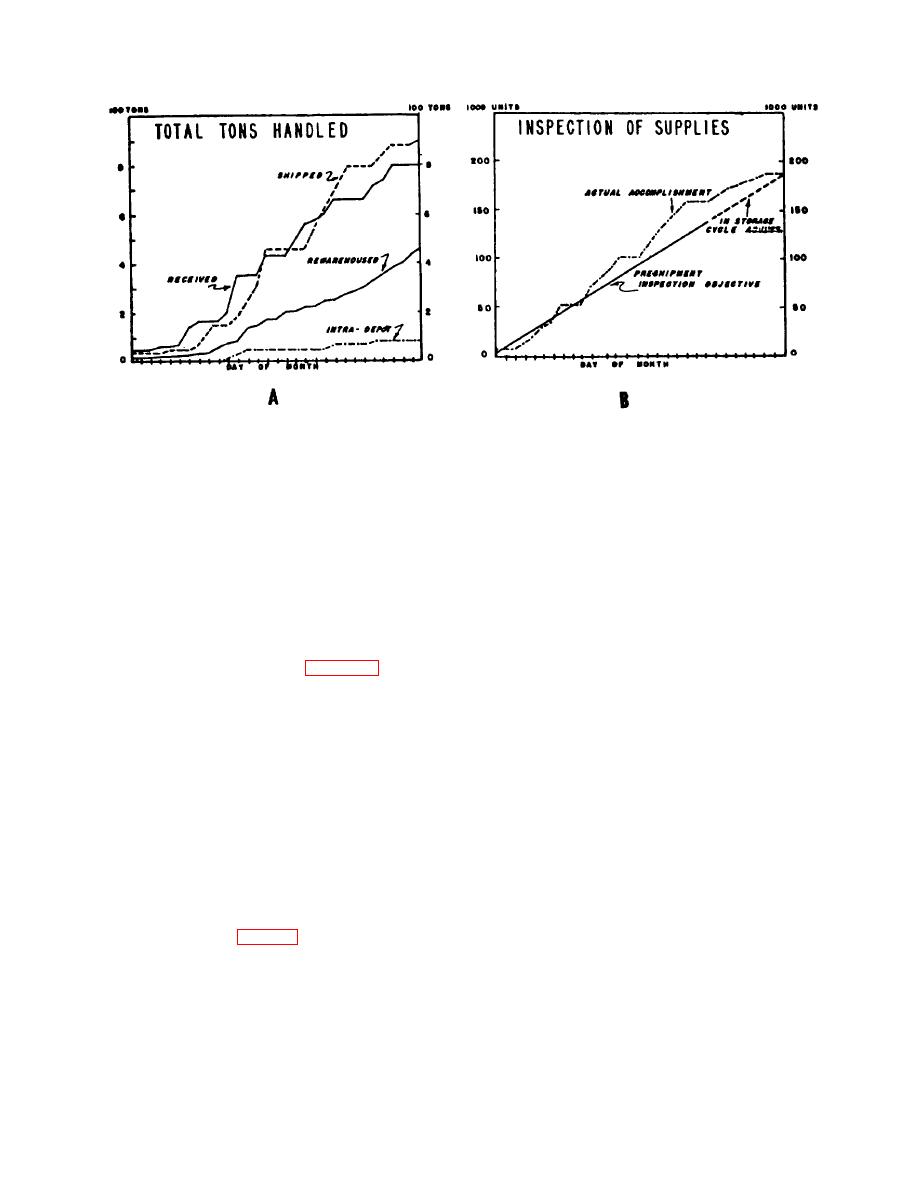
Figure 8-1. This type of chart shows where you have been, where you are, and where you are heading.
deficiencies may be entering the operation. Some of
(1) Productivity to date as better or worse and
these may be crosshauling that could be reduced or
its plus or minus relationship to the record of the
eliminated, the use of inefficient or improper vehicular
previous day or week.
equipment, or lack or proper planning or supervision.
(2) Current productivity comparison with that
Generally speaking, the less the intra-installation
of the previous month or year.
material movement and handling and the more the
tonnage handled in and out, the healthier the situation.
e. Charts may be kept on a daily, weekly, or
k. Figure 82B shows the material inspection
monthly basis according to type data presented.
(quality control) objective(s) for a given period. In the
f. In preparing charts, the first step is identification
example, the number of units anticipated for
and insertion of the acceptable performance standard.
preshipment inspection is shown together with an
g. Next, apply horizontal lines above and below
estimate of in-storage or in-process inspections planned
the identified standard. As shown in figure 8-1 (A and
or scheduled which, in the main, would have negated
B), one line is drawn at 20 percent above the standard
the need for preshipment inspection. The dotted line
and another drawn 20 percent below standard.
shows how close to attainment of the objective was the
h. An activity is rarely able to judge its progress
accomplishment.
overall by how many units are processed on a given day
but rather by how many units were processed through a
8-5. Analysis of Methods.
given date in a period of time. An acceptable means of
accomplishing this is if, beginning with the first day of
a. Analysis to precede equipment selection. MHE and
the month, the performance units per production man-
tools should not be selected or requisitioned for an
hour are inserted for that day. On the second day, the
operation until after a thorough analysis has been made
first and second day's performance is added. Average
of the materials to be handled, the conditions and
the two and insert the figure, and so on.
environment in which the work will be performed, and
the method to be employed.
i. Charts should be large enough to be easily read
and placed in a conspicuous location to command
b. Operation lists. In any handling problem, there will
attention to personnel employed in the activity.
be several specific operations which must be performed.
Listing these operations, in the sequence performed,
activity is normally the sum of tons received and tons
may be sufficient to indicate
shipped. A rise in handling intra-installation tonnage or
a continual and significant increase in intra-installation
tonnage bears investigation because a number of
8-5
|
|
Privacy Statement - Press Release - Copyright Information. - Contact Us |
